
Backtesting applies strategy rules to historical market data to estimate how the rules would have behaved. It is a research tool, not a prediction of future profit.
What a backtest actually does
Past price and volume data
The strategy is evaluated one candle at a time
Entries and exits are recorded
Return, drawdown, win rate and expectancy
Look for errors, overfitting and unrealistic fills
See the concept inside GetMyTradingBot
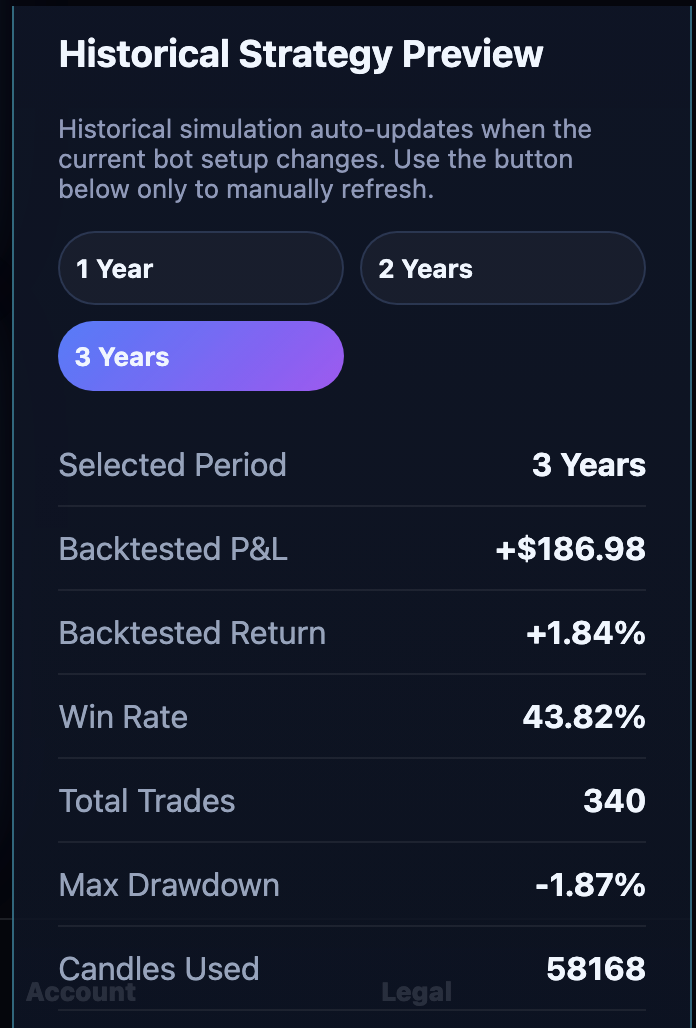
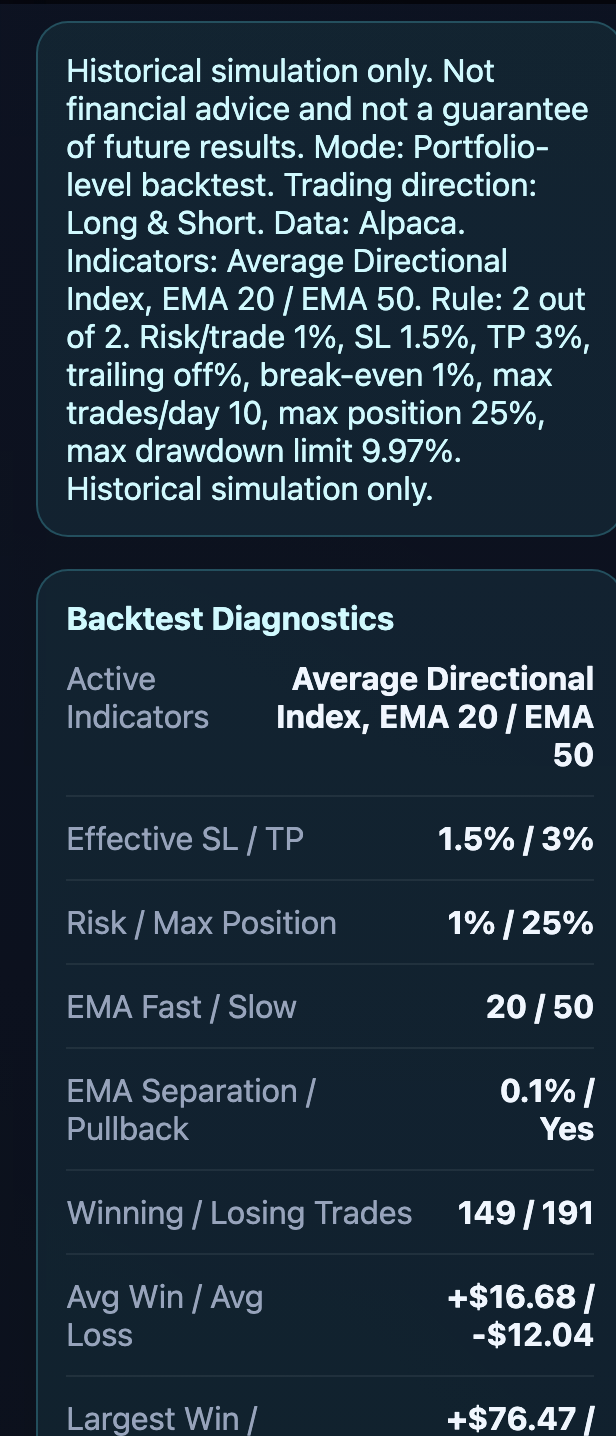
What a backtest measures
A backtest recreates hypothetical entries and exits from past candles. It can summarize completed trades, profit and loss, win rate, drawdown, average win, average loss and expectancy.
Why results can be unrealistic
Historical tests may assume cleaner fills than real trading. Results can also be distorted by missing costs, future information accidentally used by the strategy, survivorship bias or excessive parameter tuning.
- Include commissions, spread and slippage assumptions.
- Use only information available at each historical candle.
- Test different market periods.
- Keep an untouched out-of-sample period.
Metrics to review together
No single metric tells the full story. A high win rate can still lose money when average losses are much larger than average wins. Strong return can hide an unacceptable drawdown.
What to do after a backtest
Review individual trades, test nearby parameter values and then forward test with paper trading. A stable strategy should not depend on one exact setting or one unusually favorable period.
Frequently asked questions
How much historical data should I use?
Use enough data to include different conditions such as rising, falling and sideways markets. The appropriate amount depends on the timeframe and trade frequency.
Can backtesting predict future returns?
No. It describes hypothetical historical behavior under specific assumptions.
What is overfitting?
Overfitting happens when a strategy is tuned too closely to past data and captures noise that may not repeat.