
An exponential moving average gives more weight to recent prices. EMA20 reacts faster, while EMA50 moves more slowly and represents a broader recent trend.
EMA20 reacts faster than EMA50
EMA20 turns upward first
EMA20 moves above EMA50
Price action confirms or rejects the move
EMA20 turns downward faster
EMA20 moves below EMA50
How EMA20 crosses EMA50
EMA20 reacts faster to recent prices, while EMA50 moves more slowly.
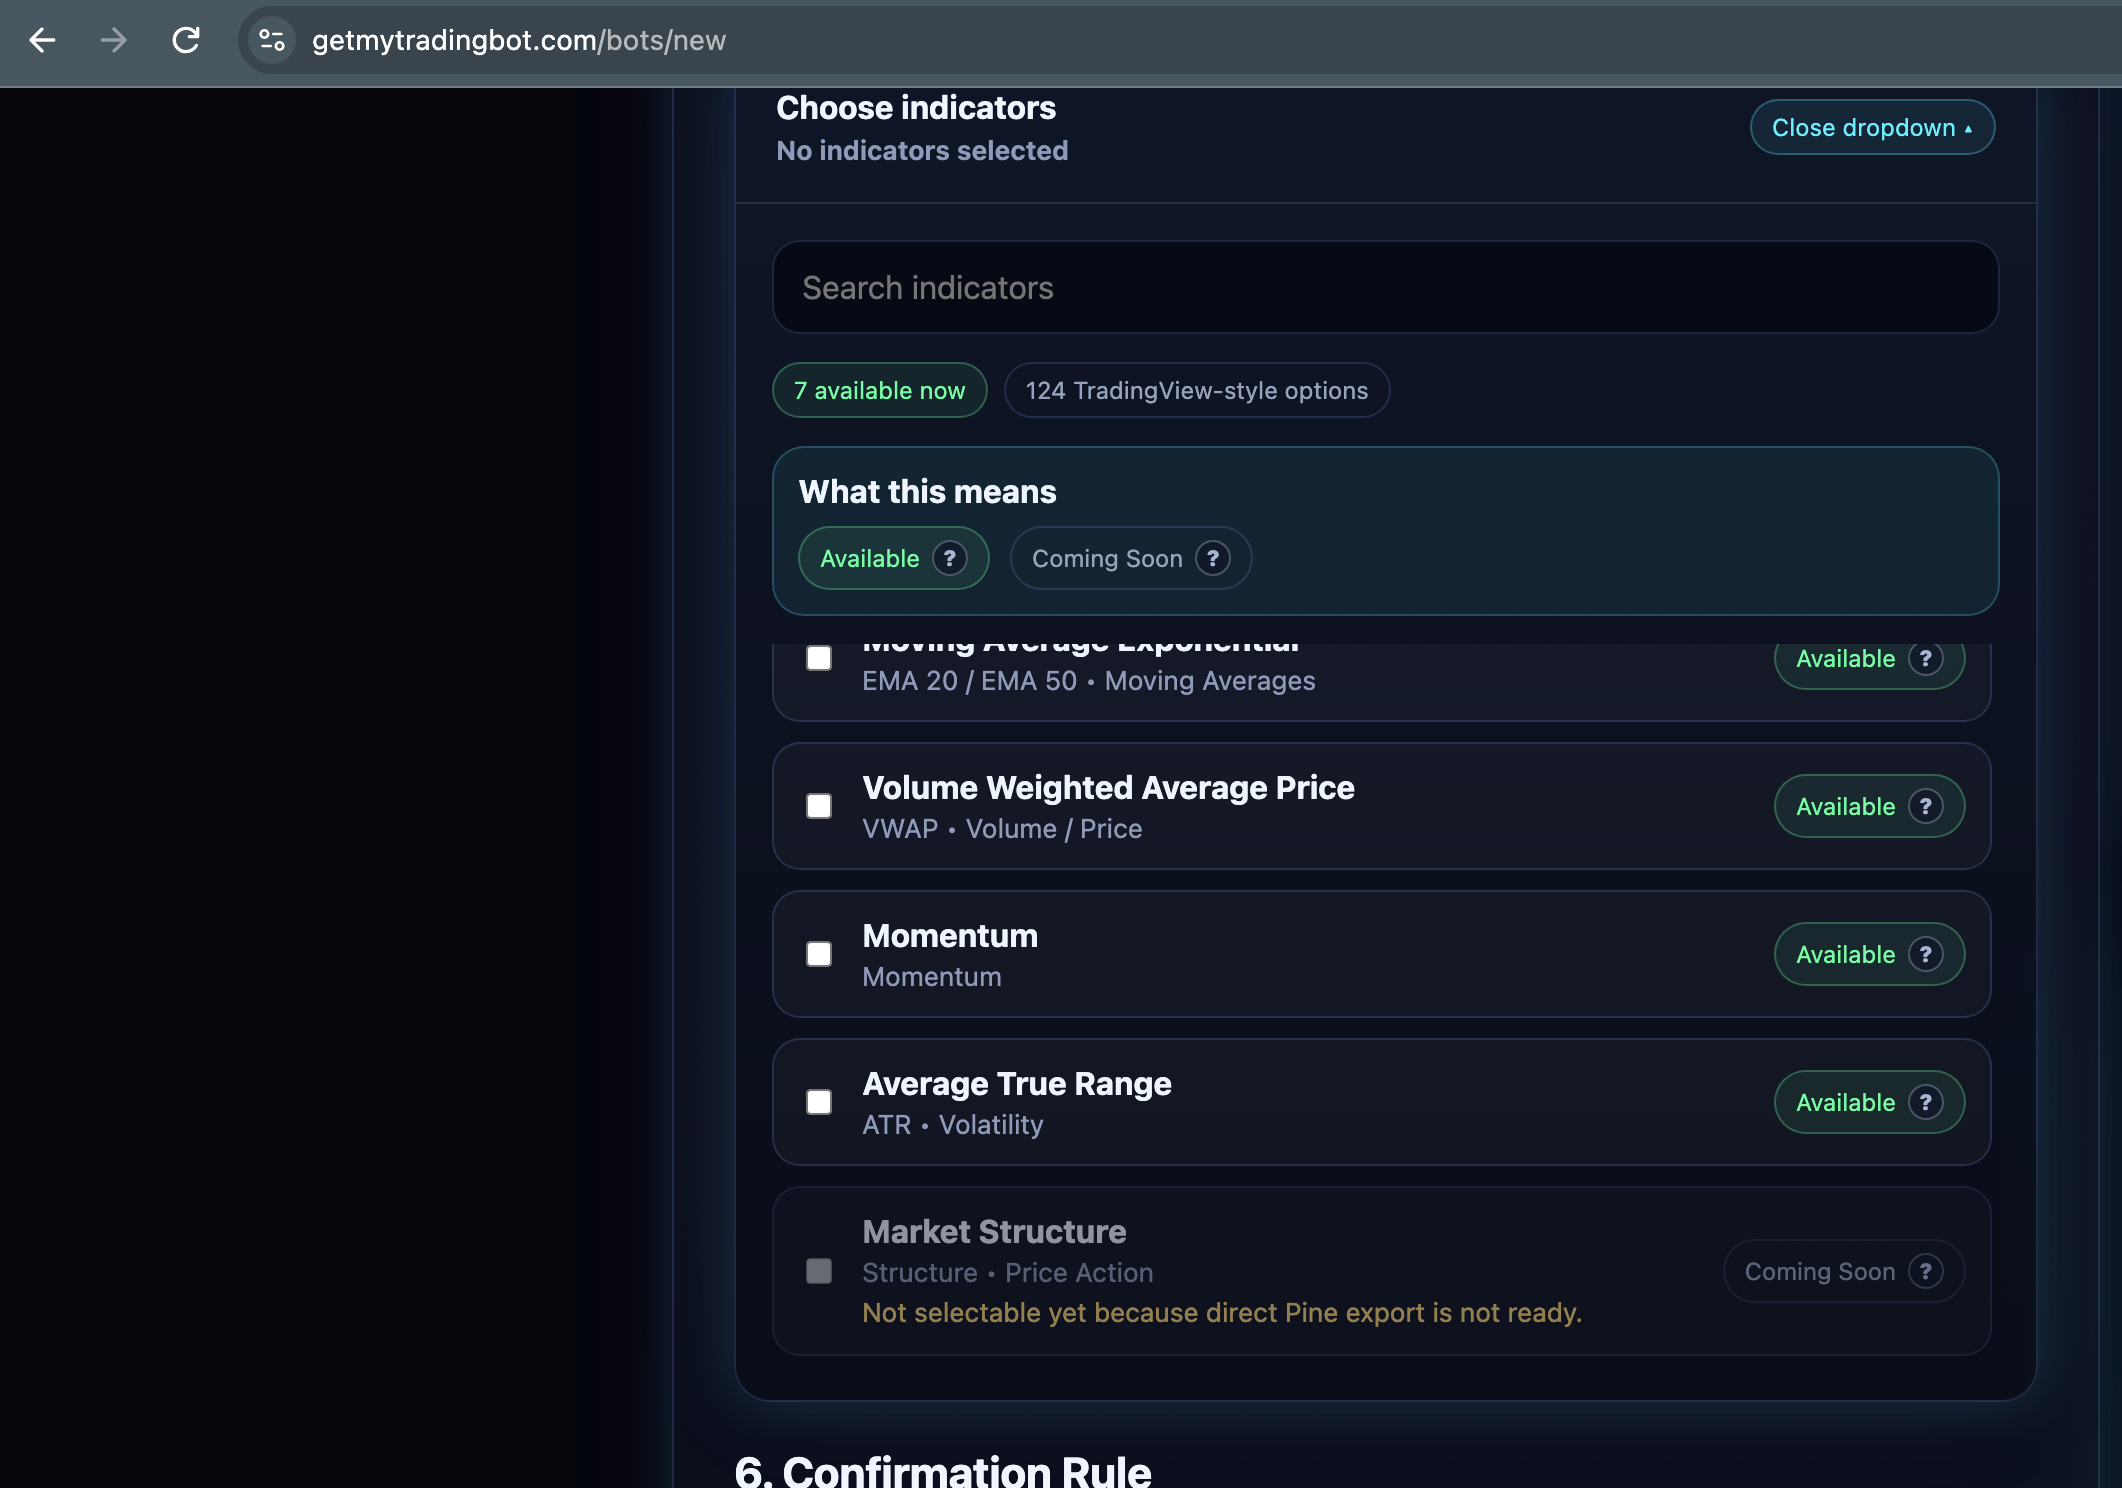
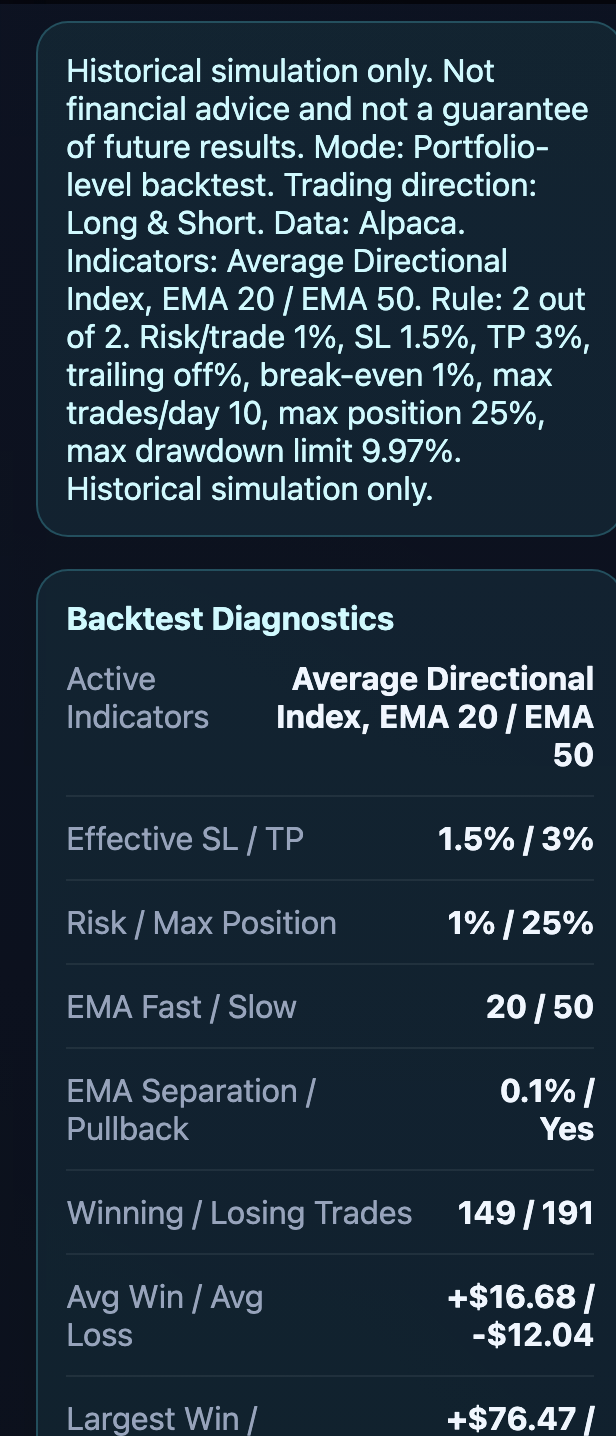
See the concept inside GetMyTradingBot
How the crossover is interpreted
When EMA20 moves above EMA50, traders may describe the recent trend as bullish. When EMA20 moves below EMA50, they may describe it as bearish. A crossover is evidence about recent prices, not a forecast.
Why false signals occur
During sideways markets, the averages can cross repeatedly without a sustained move. This is sometimes called whipsaw.
- Use a trend-strength filter such as ADX.
- Require price to remain on the expected side of VWAP.
- Use ATR to avoid trading when volatility is too low or to size exits.
- Test trading-hour restrictions.
Entry and exit choices
A strategy might enter immediately on the crossover, wait for the candle to close or require confirmation from another indicator. Exits can use the opposite crossover, a stop loss, a take-profit target or a combination.
Test the complete system
Indicator settings, timeframe, symbol, costs and risk rules all affect results. Testing only the crossover without realistic exits and sizing does not represent a complete strategy.
Frequently asked questions
Is EMA20/EMA50 better than EMA50/EMA200?
Neither is universally better. Shorter averages react faster and may trade more often; longer averages respond more slowly.
Does a bullish crossover mean buy immediately?
Not automatically. It is a signal condition that should be evaluated with the full strategy and risk plan.
Which timeframe should I use?
The timeframe should match the intended trading style and be tested with sufficient data.